
Michael Eisenberg
As the National Pastime, baseball has remained a staple of American culture ever since the 1840s. As the years have progressed and technology has advanced, baseball found itself as the early and current center of statistics in sports. This emergence as the leader of the statistical revolution slowly began in 1913, with the establishment of the record keeping company, Elias Sports Bureau, and in 1947 with the hire of Allan Roth by the then Brooklyn Dodgers (who later moved to their current home in Los Angeles). While the Elias Sports Bureau and Roth were invaluable in promoting the use of statistics in the sport, baseball starting using traditional and advanced statistics in earnest in the 1970s, with the establishment of the Society for American Baseball Research (SABR) in 1971 and Bill James's first publication of The Bill James Baseball Abstracts in 1977. The growth of Major League Baseball's use of statistical accelerated even more with the success of the Oakland Athletics in the early 2000s, who used player data to help them adhere to the Moneyball philosophy.
At a similar time of the exponential increase of statistical use in MLB, fantasy sports, including fantasy baseball, has grown in its popularity. In fantasy baseball, any number of people can form a fantasy league together, with a commissioner to oversee the league operations. Each member of the league, including the commissioner, assumes control of their own team and attempts to select, through a league draft, as many of the best players in baseball as possible. In fantasy baseball, "best" or "good" players can be determined in any number of ways, with the most common being through the points system. In the points system, players can earn a fantasy team points through positive individual actions in a game, such as getting a hit or scoring a run, and can lose points through negative individual actions in a game, such as a batter striking out or a pitcher giving up a hit. Throughout the season, a team must accumulate as many points as possible. This can be achieved by trading players with other league members (team owners) or by adding a player from the league free agent pool and dropping a player currently on the team, giving each owner as close to a feel of running a real life team as possible. At the end of the season, one team and its owner is crowned the fantasy league champion.
Many fantasy baseball leagues are single-season leagues, meaning every year the team owners select new teams from all of the players playing in MLB, with some players from the minors, being available in a draft. However, an increasing trend in fantasy sports is the concept of dynasty leagues, which provide an even closer feel of controlling a real-life team. A dynasty baseball league is long-term, meaning that there is an initial draft at the inception of the league and at the end of a season, each owner selects a certain number of players on their team they want to keep for the following season. There is then a draft of the remaining players in the player pool and teams can even trade current and future draft picks, just like teams do in professional sports. Fantasy baseball is perfect for anyone interested in baseball and statistics, as it relies on statistics to determine the point values of players, which helps determine the strongest fantasy league team at the end of the season. The points settings used to calculate the number of points produced by a player is listed under the section "Points System".
As someone interested in statistics and a fan of the Baltimore Orioles, I have recently joined a 14-member dynasty baseball league with my twin brother and both of our friends. This league, called We Are Sabermetrics, runs on the Fantrax website and relies on the aforementioned points system to determine the "fantasy value" of players. Throughout the season, teams compete in weekly matchups where the team who scores the most points in the matchups wins. At the end of the season, the top 4 teams compete in the playoffs for the league championship. Although my team made the playoffs for the shortened 2020 MLB season, much can be done to improve the team, as it struggled to score points at times throughout the season. This tutorial will provide valuable insight not just for my improvement of a team, but for anybody looking to build a dominant fantasy baseball team. It will look at traditional statistics such as Home Runs (HR) and Runs (R) as well as more advanced statistics such as Runs Created (RC) and On Base Plus Slugging (OPS). Through an analysis of t years of data for batters, the tutorial will attempt to use statistics of a player's performance in previous seasons to predict the expected performance for the season as well as the performance for the following season, which would then help determine the baseball players most likely to produce the most points for a fantasy team owner. At the end of the tutorial, you should have a better understanding of how to predict a batter's future performance and hopefully a desire to join your own fantasy baseball league, if you are currently not in a league.
The following table lists the ways in which a player can earn or lose points as well as the values. This is the points system that will be used throughout the tutorial.
| Scoring Group | Scoring Category | Points |
|---|---|---|
| Hitting | Doubles (2B) | 2 |
| Hitting | Errors (E) | -2 |
| Hitting | Hit By Pitches (HBP) | 0.5 |
| Hitting | Home Runs (HR) | 4 |
| Hitting | Runs Batted In (RBI) | 1 |
| Hitting | Runs Scored (R) | 1 |
| Hitting | Singles (1B) | 1 |
| Hitting | Stolen Bases (2B) | 2 |
| Hitting | Strikeouts (SO) | -0.5 |
| Hitting | Triples (3B) | 3 |
| Hitting | Walks (BB) | 1 |
The data dictionary for the dataframe containing all of the statistics used in the tutorial is provided with this link. There is some other data contained in the csv files, but they are not included in the data dictionary because they are immediately dropped from the ecompassing dataframe and never used in the tutorial.
The following Libaries, along with Python 3, will be used in the tutorial. Each library is linked to its documentation.
import copy
import matplotlib.patches as mpatches
from matplotlib import pyplot as plt
import numpy as np
import os
import pandas as pd
import seaborn as sns
from sklearn import linear_model
from sklearn.metrics import mean_squared_error, r2_score
import warnings
warnings.filterwarnings('ignore')
First, we must obtain the data, which involves fantasy baseball statistics for both batters from the 2015 season to the 2020 season. This tutorial does not analyze data prior to 2015 due to the limited number of player data contained in the pre-2015 files. Since the tutorial is in the context of my dynasty baseball league, We Are Sabermetrics, the statistics and points data must come from the league website. When accessing the player data, there were three categories of statistics that were of interest: Standard, Extra, and Sabermetric. There is data on pitchers and the process followed in this project to analyze batter performance could also be used to analyze pitcher performance. To access and manipulate the data, for each year, the proper csv files were downloaded from the league website and then read into Pandas DataFrames.
The following image shows an example of the league interface for viewing and downloading the data.
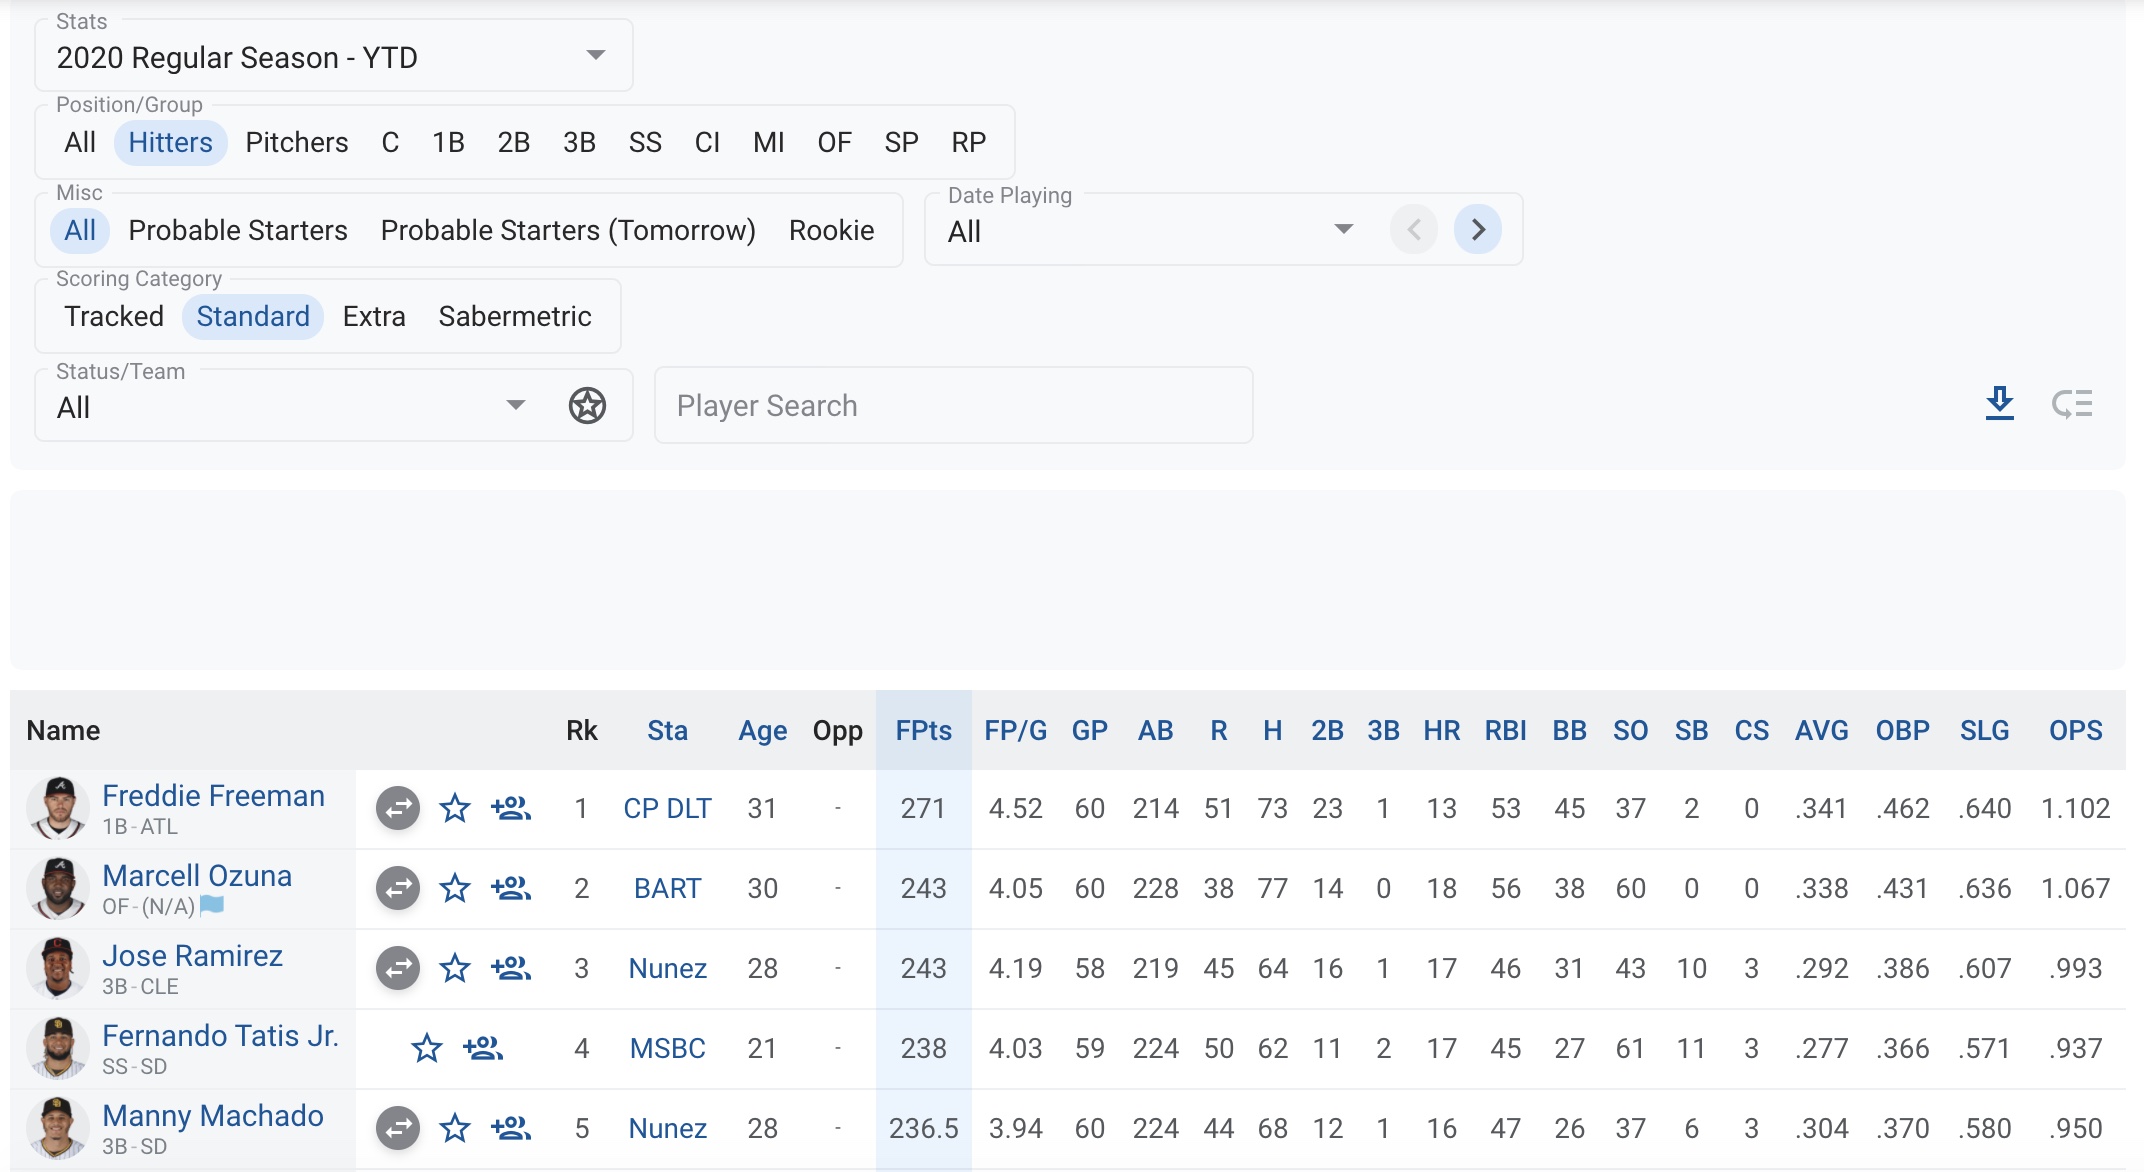
After uploading the data, we first had to combine the data for batters as appropriate. For each year, there were three csv files for batters, with each file providing some different set of player statistics. For ease of future analysis and to avoid storing duplicate data, the dataframes containing batter data must be merged together and the duplicate columns must be eliminated. At the end of this step, we have five (key, value) pairs in the stats dictionary, where each key is a unique year and each value is a list containing the merged batter data for that year.
#will contain the dataframes of the data from the csv files
stats = dict()

#find the current working directory, used in reading the csv files
cwd = os.getcwd()

#reading the csv files into dataframes and adding them to the stats dictionary
for i in range(2015,2021):
    stats[i] = []
    stats[i].append(pd.read_csv(cwd + "/" + str(i) + "/Fantrax-Players-We Love Sabermetrics.csv"))
    for j in range(1,3):
        file =  cwd + "/" + str(i) + "/Fantrax-Players-We Love Sabermetrics (" + str(j) + ").csv"
        stats[i].append(pd.read_csv(file))

#all years of the data, for each category (Tracked, Extra, Sabermetric), we have many of the
#exact same columns names. We want to remove duplicate columns and the following dropi variables
#contain the columns to be dropped.
drop1 = ((set(stats[2020][0].columns) & set(stats[2020][1].columns)) |
         (set(stats[2020][1].columns) & set(stats[2020][2].columns))).difference(['Player','FPts'])

drop2 = ((set(stats[2020][0].columns) & set(stats[2020][2].columns)) |
         (set(stats[2020][1].columns) & set(stats[2020][2].columns))).difference(['Player','FPts'])

#dropping duplicate columns and merging the batters data together, leaving
#one dataframe for batters for each year 2015-2020.
def convert_to_float(df,column):
    df[column] = df[column].apply(lambda x : float(x))

def convert_to_int(df,column):
    df[column] = df[column].apply(lambda x : int(x))

#dropping the columns that are not needed
for key in stats.keys():
    for i in range(3):
        if i == 1:
            stats[key][i].drop(drop1,axis=1,inplace=True)
        elif i == 2:
            stats[key][i].drop(drop2,axis=1,inplace=True)
        else:
            stats[key][i].drop(["Opponent","Team"],axis=1,inplace=True)
    batters = stats[key][0].merge(stats[key][1],on=['Player','FPts']).merge(stats[key][2],on=['Player','FPts'])
    stats[key] = batters
Now, we must tidy and clean the data. First, it was necessary to add a column to each dataframe representing the year from which the data came. Then, we need to filter out the batters who did not receive enough at-bats in a season. For the years 2015-2019, any player with fewer than 125 at-bats was removed. However in 2020 there was a shortened season due to the coronavirus pandemic, so the threshold for at-bats was lowered to 50. After this, the age column was modified. Initially, the age column represented the current age of the player, regardless of the value in the year column. Thus, a quick modification changed the values in the age column to represent the true age of a player during the season of the year from which the data was taken. Finally, we combine all of the batter data into one dataframe, all_batters, and converted each column type to be more representative of the true column type of the data in the column.
stats_to_int = ['Rk', 'Age', 'GP', 'AB', 'R', 'H', '2B', '3B', 'HR', 'RBI', 'BB',
                'SO', 'SB', 'CS', 'RC', 'TB', 'XBH', 'PA', 'year']
stats_to_float = ['FP/G', 'FPts','AVG', 'OBP', 'SLG', 'OPS', 'BB/PA', 'K/PA', 'ISO', 'BABIP', 'WOBA']

#creating the years column and filtering out batters who do not have enough at-bats
for i in range(2015,2021):
    if i == 2020:
        stats[2020] = stats[2020][stats[2020]['AB'] >= 50]
    else:
        stats[i] = stats[i][stats[i]['AB'] >= 125]
    stats[i]['year'] = i
    stats[i]['year'] = i

#age is initially constant for a player regardless of year, so that is fixed here
for year in range(2015,2020):
    stats[year]['Age'] = stats[year]['Age'] - (2020 - year)

#deep copies and appends each dataframe in a dictionary of dataframes
def get_all_bp(players_data, start_year=2015,end_year=2021):
    all_data = copy.deepcopy(players_data[start_year])
    for year in range(start_year + 1, end_year):
        all_data = all_data.append(copy.deepcopy(players_data[year]),ignore_index=True)
    return all_data

#combining the stats of all batters into 1 dataframe and removing more not needed columns
all_batters = get_all_bp(stats)
for stat in stats_to_int:
    convert_to_int(all_batters,stat)

for stat in stats_to_float:
    convert_to_float(all_batters,stat)

all_batters.drop(['CYC','Sl','GIDP','SF','SH','IBB','HBP','Status'],axis=1,inplace=True)
To be able to predict which batters will perform well, it would be helpful to understand the distribution of points scored as well as what statistics most heavily influence the number of points scored. In this section, we will explore the relationships between many statistics and fantasy points per game to determine if each statistic analyzed plays a large role in determining the quality, determined by the amount of points per game scored, of a player. The statistics that are determined to impact the points per game of a batter will be considered in a linear regression model predicting the performance level of players.
We start the analysis with the following histogram that displays the distribution of fantasy points per game using the all_batters dataframe.
ppg_batters = all_batters['FP/G']

#creating the distribution
plt.figure(figsize=(8,6))
plt.hist(ppg_batters,bins = 50)
plt.xlabel('Fantasy Points Per Game')
plt.ylabel('Number of Players')
plt.title('Fantasy Points Per Game for Batters')

plt.show()

In the above histograms, we immediately notice that the distribution of fantasy points per game for batters has a slight right skew and a median of around 2.0 points per game, with the mean being higher due to the right skew. The right skew indicates that there is usually a few players who have excellent batting seasons and perform much better than the rest of the players.
The amount of points per game seems rather low when evaluating the histogram, especially when taking into considering the league's points system. However, one must realize that batters play almost every day and fantasy baseball matchups typically last one full week, so batters will quickly accumulate points. Additionally, an owner who has a good grasp of the players, their situations, and their abilities will be able to pick players who easily clear the average points per game for qualifying batters in a season. As a matter of fact, the team that won the championship had all but three of its batters score at least 2.47 points per game and five of its batters score more than 3 points per game. While this may be difficult to consistently achieve, it does highlight that a league winning fantasy team has most of its players score well above the approximately 2.0 median points per game as shown by the histogram.
Even though the above distribtuion does not directly relate to the question of predicting a batter's expected or performance, it does provide a basic background into the fantasy points scored each game as well as the performance level required for a baseball player to be considered good for fantasy. This, as well as an understanding of positional value, allows fantasy owners to determine how much to generally invest in a given player in terms of draft capital or by making a trade.
batters_ab = all_batters['AB']
batters_gp = all_batters['GP']

#creating the scatter plots
fig, ax = plt.subplots(1, 2,figsize=(15,8))
ax[0].scatter(batters_gp,ppg_batters)
ax[0].set_xlabel('Games Played')
ax[0].set_ylabel('Fantasy Points Per Game')
ax[0].set_title('FP/G v. GP for Batters')

ax[1].scatter(batters_ab,ppg_batters)
ax[1].set_xlabel('At Bats')
ax[1].set_ylabel('Fantasy Points Per Game')
ax[1].set_title('FP/G v. AB for Batters')

plt.show()

Another important thing to point out is the relationship between playing time and points per game. Playing time is considered by both games played and the number of at bats. When evaluating both scatter plots of points per game v. playing time, the relationship between points per game and playing time is unclear. In the plot of Points Per Game v. At Bats, there appears to be a moderately strong and positive linear relationship between the two statistics. However, the plot of Points Per Game v. Games Played shows what appears to be a non-linear relationship. While this relationship is not strong, it does have more of a quadratic appearance than a linear appearance.
The linear relationship between At Bats and Points Per Game should be expected, however, a player having more At Bats does not significantly impact their points per game. While more At Bats does lead to more in-game opportunities for a batter, these number represent the value over the course of a season. A batter will likely earn more at bats if they are playing well, so we should say that a higher value of Points Per Game leads to an increase in opportunities, or At Bats, not the other way around. Thus, At Bats should not reliably be used to predict the points per game earned by a batter. That same idea would apply to the amount of games played, regardless of whether the relationship is quadratic or linear, as a player will get more opportunities to play if they play well, a basic idea of any sport.
age2029 = all_batters[(all_batters['Age'] <= 29)]
age3039 = all_batters[(all_batters['Age'] > 29)]

fig, ax = plt.subplots(2,1,figsize=(15,10))
sns.violinplot(data=age2029,x='Age',y='FP/G',ax=ax[0])
sns.violinplot(data=age3039,x='Age',y='FP/G',ax=ax[1])

ax[0].set_title('FP/G distributions by Age for ages 20-29')
ax[1].set_title('FP/G distributions by Age for ages 30-40')
plt.show()

Now, we must determine what factors best predict a player's performance, as we cannot use all of the statistics in our model to predict player performance. In the linear regression model, one of the assumptions is that there does not exist perfect collinearity between the variables used in the model. For example, if both hits and batting average have a strong linear relationship with each other, then the linear regression model cannot include both of hits and batting average. Thus, it is important to explore what might impact a player's performance in fantasy baseball, what of those impactful variables have a linear relationship with each other, and select the variables that appear to most strongly impact performance.
We first start with the age of a batter. A player's age, in any sport, could impact their performance because as players get older, they gain more experience and knowledge in the game. However, their bodies are expected to be less able to handle the rigors of a full 162-game season as they get older. With that in mind, we plotted the violin plots above. Contrary to expectations, there does not seem to be, with a few exceptions, much of an impact of age on points scored per game. Most of the ages have a mean points per game of around 2 except for players aged 20, 21, 39, or 40, the two youngest and two oldest ages. A likely explanation for this is since few baseball players earn significant playing time at those young ages and the ones that do are typically expected to be among the best players in baseball in their careers, the sample size is too small and biased towards those uber-talented players. Additionally, the distribution for players aged 39 and 40 contains a small number of players such that we cannot properly determine the distribution of points per game for players of those ages.
It is also important to point out the distribution of the points per game as seen in the above plots. There appears to be two sets of ages, 22-28 and 29-34, with similar distributions while the rest of the years have their own unqiue distributions. Although we could attempts to quantify the changes in distributions of fantasy points per game by age, the distributions do not change in a distinctive pattern nor do many of the ages have a different mean points per game. Therefore, it is unlikely that age plays much, if any, of an impact on a player's performance.
std_batters = copy.deepcopy(all_batters)
std_batters = std_batters[['Player','year','H','R','HR','RBI','FP/G']]

#finds the mean value of a column (column) in a dataframe (df), given the row's (row) year
def mean_column(df,row,column):
    return dict(df.groupby('year')[column].mean())[row['year']]

#finds the standard deviation of a column (column) in a dataframe (df), given the row's (row) year
def std_column(df,row,column):
    return dict(df.groupby('year').column.std())[row['year']]

#standardizing the ['H','R','HR','RBI','FP/G'] columns
for stat in ['H','R','HR','RBI','FP/G']:
    std_batters['mean' + stat] = std_batters.apply(lambda row : mean_column(std_batters,row,stat),axis=1)
    std_batters['std' + stat] = std_batters.apply(lambda row : mean_column(std_batters,row,stat),axis=1)
    std_batters[stat + "z" ] = (std_batters[stat] - std_batters['mean' + stat]) / std_batters['std' + stat]

fig, ax = plt.subplots(2,2,figsize=(15,10))
ax[0][0].scatter(std_batters['Hz'],std_batters['FP/G'])
ax[0][0].set_title('FP/G v. H')
ax[0][0].set_xlabel('Standardized H')
ax[0][0].set_ylabel('Points Per Game')

ax[0][1].scatter(std_batters['HRz'],std_batters['FP/G'])
ax[0][1].set_title('FP/G v. HR')
ax[0][1].set_xlabel('Standardized HR')
ax[0][1].set_ylabel('Points Per Game')

ax[1][0].scatter(std_batters['Rz'],std_batters['FP/G'])
ax[1][0].set_title('FP/G v. R')
ax[1][0].set_xlabel('Standardized R')
ax[1][0].set_ylabel('Points Per Game')

ax[1][1].scatter(std_batters['RBIz'],std_batters['FP/G'])
ax[1][1].set_title('FP/G v. RBI')
ax[1][1].set_xlabel('Standardized RBI')
ax[1][1].set_ylabel('Points Per Game')

plt.show()

Now, we determine the impact of four related statistics, hits (H), home runs (HR), runs (R), and runs batted in (RBI) on a player's points per game. Immediately, we notice that there appears to be a positive relationship between each of the above statistics and points per game. Intuitively, this makes sense, as each provide positive points to a fantasy team when produced by a player and more productive players should have higher amounts of hits, runs, home runs, and RBIs. Since each of these statistics plays a large role in a player's points per game, each could potentially be used to predict the performance level of a player.
Another thing that jumps out from the above plots is that the scatter plots of FP/G v. each of H, R, and RBI all look very similar. This result is obvious once we realize that in order to score or to drive in a run, a batter will typically need to walk or get a hit. Since players get hits far more often than they walk, R and RBI are highly dependent on the amount of hits by a batter. Without the hits, a batter will score or drive in a run very rarely. This means that in a linear model, we cannot use all of hits, runs, and runs batted in to predict the points per game produced by a player.
For the above plots, each of H, R, HR, and RBI were standardized prior to being plotted because as previously mentioned, the 2020 season was only 60 games instead of the typically 162. This could lead to outliers or leverage points, which can impact the analysis in an undesired manner. The standardization does not change the overall insights of the analysis. Instead, it, along with the plots, tells us how much better than the mean a player typically produces of a certain statistic to reach some points per game level.
fig = plt.figure(figsize=(15,10))
patches=[]
scoring={'2B' : 2, 'E' : -2, 'HBP' : 0.5, 'HR' : 4, 'RBI' : 1, 'R' : 1, '1B' : 1, '2B' : 2,
         'SO' : -0.5, '3B' : 3, 'BB' : 1,'SB' : 2}
to_plot={'1B':'red','R':'green','2B' : 'blue','3B' : 'orange','HR' : 'yellow','RBI' : 'purple',
         'BB':'pink','SB':'olive'}

mean_batters = all_batters.groupby('year').mean().reset_index()
mean_batters['1B'] = mean_batters['H'] - mean_batters['HR'] - mean_batters['3B'] - mean_batters['2B']
mean_batters = mean_batters[['year','GP','FPts','FP/G','R','1B','2B','3B','HR','RBI','BB','SB']]

for stat in to_plot.keys():
    mean_batters[stat] = mean_batters.apply(lambda row : row[stat]*scoring[stat]/162 if row['year'] != 2020
                                            else row[stat]*scoring[stat]/60, axis = 1)

for stat in to_plot.keys():
    sns.pointplot(x=mean_batters['year'],y=mean_batters[stat],color = to_plot[stat])
    patch = mpatches.Patch(color=to_plot[stat], label=stat)
    patches.append(patch)

plt.legend(handles=patches)
plt.title('Year v. Points Per Game for Traditional Statistics')
plt.xlabel('Year')
plt.ylabel('Points Per Game')
plt.show()

The impact of runs, RBI, home runs, and hits on a player's points per game as seen in the previous scatter plots is further confirmed here. The above chart plots the mean points per game generated by singles (1B), doubles, triples, home runs, runs, RBIs, walks, and stolen bases. Hits was broken up into 1B, 2B, 3B, and HR to visualize the impact of each type of hit on the points per game because otherwise most of the lines would appear at the bottom of the chart with a lot of space between those lines and the line representing points per game generated by hits. The amount of hits clearly has a significant impact on the points per game for players. What is interesting is that of the four hit categories, home runs and singles contribute in a similar amount and much more significantly than doubles and triples. As a matter of fact, triples contribute very little to the points per game for a batter, even though a player produces 3 fantasy points for a triple and only 1 for a single and 2 for a double, due to the rarity of the triple in modern baseball.
Another interesting part of the graph is how runs and RBIs, even though there is a difference between the two in their overall contributions to points per game, increase and decrease by nearly the same amount every year. As seen in the scatter plots above for R v. FP/G and RBI v. FP/G, both of these had plots that looked very similar. Additionally, the discussion of those plots mentions how both depend highly on a batter's number of hits. Both runs and RBIs can clearly help predict a player's performance, so they should be used, albeit separately in a linear model predicting a batter's performance.
It is important to note that 1B represents singles and is not in the original dataset. However, singles can be calculated using the following formula:1B = H - HR - 3B - 2B
This is not included in the original dataframe because singles can easily be calculated when needed and they are not used in any of the regression models.
fig, ax = plt.subplots(2,2,figsize=(15,10))

on_base = ['AVG', 'OBP', 'SLG', 'OPS']

for i in range(4):
    ax[int(i/2)][i % 2].scatter(all_batters[on_base[i]],all_batters['FP/G'])
    ax[int(i/2)][i % 2].set_title('FP/G v. ' + on_base[i])
    ax[int(i/2)][i % 2].set_xlabel(on_base[i])
    ax[int(i/2)][i % 2].set_ylabel('FP/G')

plt.show()

Now that we understand how the counting statistics such as runs, hits, and home runs impact player performance, let's investigate how statistics incorporating those counting statistics predict performance. Even though these statistics (such as batting average) do not directly impact the amount of points earned by a player, they incorporate many of those statistics and are commonly used in any discussion or evaluation of the quality of a batter. The top left plot above plots the relationship between points per game and batting average. There appears to be a moderate and positive linear relationship between the two variables, which is consistent with the above results. Since batting average is simply the expected number of hits every time a batter steps up to the plate and there is a positive linear relationship between hits and points per game, the plot of batting average v. points per game should also show a positive linear relationship.
The subsequent plot, FP/G v. OBP, displays an even stronger linear relationship than the previous plot of FP/G v. AVG. As a matter of fact, the plots get increasingly linear and show less variability up to the last plot, FP/G v. OPS, which displays a powerful linear relationship between fantasy points per game and OPS. The graph using OBP displays a stronger relationship than the graph using AVG because OBP takes into account the amount of walks and other statistics beyond hits. The plot using SLG displays a stronger linear relationship than avg because SLG takes into account the type of hit a batter had, accounting for whether more hits were singles, doubles, triple, or home runs. Since the different hit types result in a different amount of points added, SLG will always be at least as good at predicting a players performance as the player's batting average.
When creating a model, OPS will be the chosen statistic out of these four because of the strength of its linear relationship with points per game. FP/G v. OPS displays the strongest relationship because OPS is simply the sum of OBP and SLG. Since OPS incorporates both of those statistics and both OBP and SLG incoroprate hits, OPS will always provide a stronger predictive ability for points per game than AVG. It is not initially clear, however, why OPS displays a stronger relationship than both OBP and SLG if it is just the sum of those two statistics. An explanation of this result could be that by combining two statistics that evaluate slightly different aspects of a batter's performance, OPS account for more factors that could impact a batter's points per game, which leads to a stronger linear relationship.
advanced_stats = ['BB/PA', 'K/PA', 'ISO', 'BABIP', 'WOBA','RC']

fig, ax = plt.subplots(2,3,figsize=(15,10))

for i in range(6):
    ax[int(i/3)][i % 3].scatter(all_batters[advanced_stats[i]],all_batters['FP/G'])
    ax[int(i/3)][i % 3].set_title('FP/G v. ' + advanced_stats[i])
    ax[int(i/3)][i % 3].set_xlabel(advanced_stats[i])
    ax[int(i/3)][i % 3].set_ylabel('FP/G')

plt.show()

Now, we evaluate the relationship between 6 different advanced statistics and points per game. The first two plots, of walks per plate apppearance and strikeouts per plate appearance display some rather surprising results. Since walks contributes positively to points per game and strikeouts contribute negatively to points per game, a strong linear relationship for the plots of both BB/PA v. FP/G and K/PA v. FP/G was expected. However, there appears to be almost no linear relationshp between walks per plate appearance and points per game and a weak but negative relationship between strikeouts per plate appearance and points per game. Especially as the "Three True Outcomes" become even more common, a stronger relationship in the first two plots was expected. However, upon analysis of the two plots, we can see why the relationship is weak or nonexistent. In the BB/PA v. FP/G plot, we have most of the data points between 0.05 and 0.2 and in the K/PA v. FP/G plot, most are the data points are between 0.1 and 0.4. Since the endpoints of the intervals for K/PA v. FP/G are twice as large as the endpoints for BB/PA v. FP/G, strikeouts and walks have opposite effects on points, and the value of the impact of strikeouts is 1/2 of the value of the impact of walks, the relative lack of a linear relationship between the two plots is much more understandable.
Although the first two plots did not show much of a linear relationship, the plots of ISO v. FP/G and WOBA v. FP/G do show a linear relationship. This result was not surprising because ISO is calculated as (AVG - SLG) and WOBA is determined by walks, hit by pitches, and each of the four types of hits. Both are determined by statistics previously determined to be related to a batter's performance, so ISO and WOBA should at least have a similar strength of relationship with points per game as those statistics like average and hits. While the plot of ISO v. FP/G shows a clear relationship, the plot of FP/G v. WOBA shows a stronger relationship between the two statistics. As a matter of fact, WOBA has a similar shape and relationship strength as the previous graph of FP/G v. OPS.
The most interesting result is the plot of points per game v. runs created (RC). In this plot, there appears to be a hard lower bound for points per game given the amount of runs created and overall there appears to be a strong linear relationship. This result was expected because runs created attempts to estimate how much a player contributes to his professional team's ability to score and accounts for hits, walks, and total bases. There are many different forms of this statistic, and each is a powerful indicator of a batter's performance. Lastly, the graph for BABIP v. FP/G shows zero relationship between the two statistics, an unsuprising result given that BABIP varies wildly, even for the best performing batters.
all_batters['RCPA'] = all_batters['RC'] / all_batters['PA']

advanced_stats = ['OPS', 'RCPA']

fig, ax = plt.subplots(1,2,figsize=(15,10))

for i in range(2):
    ax[i].scatter(all_batters[advanced_stats[i]],all_batters['FP/G'])
    ax[i].set_title('FP/G v. ' + advanced_stats[i])
    ax[i].set_xlabel(advanced_stats[i])
    ax[i].set_ylabel('FP/G')

plt.show()

Here, we compare the relationship of OPS and Runs Created per Plate Appearance (RCPA) and fantasy points per game. RCPA was calculated by dividing the value for runs created by a player's number of plate appearances. This was done because a batter cannot produce a higher number of runs created given a certain number of plate appearances. Thus, RCPA was created to allow for runs created data across different players and seasons to be more easily compared. When evaluating the above scatter plots, RCPA has a very strong linear relationship with points per game, as expected due to the relationship between runs created and statistics such as hits. We also notice that while both appear to have a very strong relationship with points per game, OPS appears to have a stronger, albeit very slightly stronger, relationship with fantasy points per game than RCPA. As a result, OPS should better predict a players performance than RCPA.
We have seen how many of the statistics play an important role in determining the fantasy baseball points per game produced by a batter as well as the relationships betweeen points per game and advanced statistics such as runs created. Now, we must combine the knowledge we have gained and created linear regression models that predict a player's expected fantasy output, keeping in mind that we cannot violate the multicollinearity assumption, which says that we cannot have multiple independent variables in the model having a clear linear relationship with each other.
There will be a total of 6 different multi-linear regression models created, with each relying on a different subset of statistics to predict a player's expected points per game, with the independent variables in each model confirmed to not violate the multicollinearity assumption. The models will be created by running on a training set, which will be 75% of the all_batters dataset, and then tested on the test set, which is the remaining 25% of the all_batters dataset. The subset of independent variables were selected through an exploratory analysis of the impact of different sets of independent variables as well as an effort to include as many of the above statistics that showed a linear relationship with points per game as possible. This will allow for a comparison of the predictive power of each set of independent variables. The different sets of independent variables (statistics) used to predict points per game are as follows:
#the list of the sets of variables for predicting points per game
predictors =[['RCPA','RBI','K/PA'], ['OPS','K/PA'], ['WOBA','R'], ['ISO','AVG','RBI'], ['SLG','H'], ['HR','OBP']]

#obtaining the training and testing data
train = all_batters.sample(frac = 0.75, replace = False)
test = all_batters[~all_batters.isin(train)].dropna() #all data in all_batters and not in the training set

#will contain the models
models = []
#contains the measure of success of the models (mse, r^2)
df_list = []
results_df = pd.DataFrame()

#for use in bar graps

for i in range(6):
    model = linear_model.LinearRegression()
    model = model.fit(train[predictors[i]],train['FP/G'])
    predictions = model.predict(test[predictors[i]])
    r2 = r2_score(test['FP/G'], predictions)
    mse = mean_squared_error(test['FP/G'],predictions)

    models.append(model)
    models.append(predictions)

    model_name = "Model " + str(i + 1)
    df_list.append({'Model_Name' : model_name, 'r2' : r2, 'mse' : mse})

results_df = pd.DataFrame(df_list)
fig, ax = plt.subplots(1,2,figsize=(20,10))
plot1 = sns.barplot(x='Model_Name',y='r2',data=results_df,ax=ax[0])
ax[0].set_title('R^2 Score for the Different Models',fontsize=20)
ax[0].set_xlabel('Model',fontsize=16)
ax[0].set_ylabel('R^2 Score',fontsize=16)

plot2 = sns.barplot(x='Model_Name',y='mse',data=results_df,ax=ax[1])
ax[1].set_title('MSE Score for the Different Models',fontsize=20)
ax[1].set_xlabel('Model',fontsize=16)
ax[1].set_ylabel('MSE Score',fontsize=16)

plot_lst = [plot1,plot2]

for plot in plot_lst:
    for p in plot.patches:
        plot.annotate(format(p.get_height(), '.3f'),
                       (p.get_x() + p.get_width() / 2., p.get_height()),
                       ha = 'center', va = 'center',
                       xytext = (0, 9),
                       textcoords = 'offset points')
plt.show()

print("Model 1")
print("Model 1 predictors:",predictors[0])
print("Model 1 Coefficients:", models[0].coef_)
print("Model 1 Intercept",models[0].intercept_)
print()
print("Model 3")
print("Model 3 predictors:",predictors[2])
print("Model 3 Coefficients:", models[2].coef_)
print("Model 3 Intercept",models[2].intercept_)
Model 1
Model 1 predictors: ['RCPA', 'RBI', 'K/PA']
Model 1 Coefficients: [ 1.41146950e+01  8.00751830e-03 -1.46835067e+00]
Model 1 Intercept 0.4814960656851932

Model 3
Model 3 predictors: ['WOBA', 'R']
Model 3 Coefficients: [ 5.52038912 -1.77312415]
Model 3 Intercept -1.5223788815094408
Above, we see the predictors as well as the corresponding coefficients for Model 1 and Model 3, the two strongest models.
Once the models were created, it was important to determine how well each model predicted a player's performance based on certain statistics. These results, in terms of the r^2 score and the mean squared error, are plotted in separate bar charts, allowing for easy comparisons of the different models. When evaluating the bar charts, two models, Model 1 and Model 3, stand out as the most effective in predicting a players points per game. These two models had higher r^2 scores than the rest of the models and the difference between the two models in terms of r^2 score was less than 0.01, meaning that the difference in the variability explained by the two models was less than 1%, a very low number. The high performance of Model 1 and Model 3 can further be seen in the bar plot for mean squared error, where both models have a clear lower mean squared error than the others and again the differece in the two values was less than 0.01. For mean squared error, this means that the difference of errors in predicting points per game between Model 1 and Model 3 was exceedingly low. Based on these results, it is difficult to truly say which of Model 1 or Model 3 is the best of the six total models. Even though Models 1 and 3 are the clear two best models, the other four models still performed well, all having low mean squared error values and r^2 values of greater than 0.7.
We can say that using a combination of RCPA, RBI, and K/PA or a combination of WOBA and R is best to determine a player's performance. The models predict a player's expected performance, and can potentially identify where players underperformed or overperformed by a significant amount. By understanding which players underperformed expectations, fantasy owners can see which players may be undervalued and allocate some resources to target the portion of players who should perform better the following season. By understanding which players who performed as or close to expected, fantasy owners can answer questions such as "Is this player's good or bad performance a true reflection of their abilities or should my expectations of their production be adjusted?" Correctly ansewring this question, as well as others, is vital to the success of a fantasy team, as any fantasy owner needs to be able to identify which players will continue their higher or lower performance levels in the upcoming season. Finally, by determing which players overperformed expectations, a fantasy owner can allow other teams in the league to spend resources on acquiring that player, leaving better and potentially cheaper players to still be available for acquisition. Overall, a combination of advanced and traditional statistics, with the specific statistics used up to the discretion of each fantasy player, are required to determine the expected points per game generated by a batter.
While much insight was gained throughout this tutorial, more analysis and data could be used to create more powerful models and provide fantasy baseball owners with even stronger tools to predict which players will perform the best. As mentioned previously, for each year analyzed, not all of the needed player data was available, mostly for the earlier year used in the analysis. Additionally, the value in the Position column of the all_batters dataframe only represented the current position the batter plays in the field and it is not a reflection of the position for which the batter qualified (played) in that year. In a subsequent analysis, we could pull data from a site such as Statcast to pull an even larger amount of data than seen here. While that data would have to be modified to ensure that the league settings and scoring system are properly followed and accounted for, it could provide information on more advanced statistics such as exit velocity or wins above replacement (WAR). Additionally, analysis and future prediction of performance can be made on pitchers, separating starting pitchers and relief pitchers, as well as by the fielding position of batters. Or, in a very powerful model, we can predict career trajectories in fantasy baseball based on minor league and major league statistics. There are many ways in which to go about this analysis, and the insight provided here is just a small portion of what can be done.
To read more about interesting topics or stories in baseball, click on any of the following links. While some require knowledge about baseball and fantasy baseball, each article can be read and understood by anyone.